


A campaign goes live. The email is out. Social posts are picking up reactions. Then somebody asks the question that matters: is any of this working?
That is when the tab collection begins. Your email platform. Social dashboards. GA4. The CRM. Maybe a spreadsheet somebody made three months ago that no one wants to touch. The answer is usually in there somewhere. Finding it, and making sense of it, becomes the job.
I have watched smart marketers spend hours piecing together a story their tools should have told them from the start: what they shipped, who engaged, what happened next, and whether it moved the business forward.
That is a strange way to run marketing.
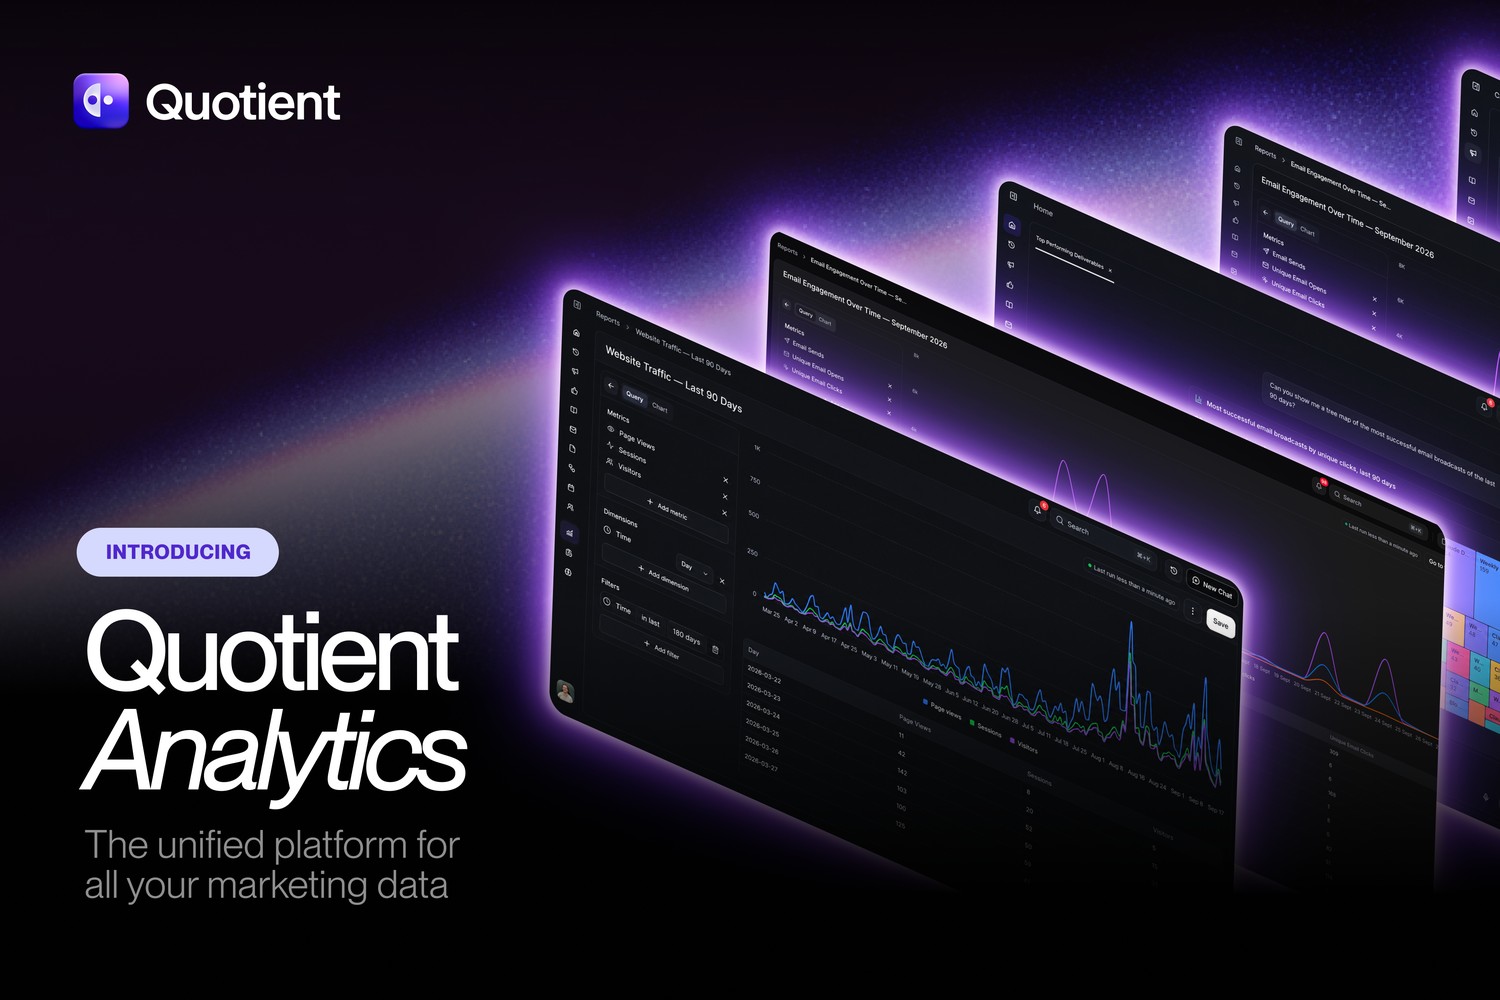
Today, we are launching Quotient Analytics: a unified analytics suite built into the same platform where you plan campaigns, create content, send email, publish social, and run your marketing.
Marketing data got separated from marketing work
Analytics itself is not the problem. Most teams have plenty of it.
The problem is that marketing data has been split apart from the work it is supposed to measure. Email results live in one place. Social results live somewhere else. Website behavior lives in GA4. Pipeline data lives in the CRM. The campaign brief, the assets, and the decisions that shaped all of it live somewhere else again.
So marketers build the missing connective tissue themselves. They add UTMs. They export CSVs. They reconcile dates. They make sure naming conventions held up. They try to remember why a campaign went live the way it did.
For a small team, this is work nobody has time for. For a larger team, it becomes a process full of handoffs and exceptions. Either way, learning arrives late, if it arrives at all.
The frustrating part is that the data is already there. It just does not know how to tell one coherent story.
We built the reporting layer into the execution layer
Quotient is an agentic marketing automation platform that actually automates marketing. That means we have always cared about the work after the draft: organizing the campaign, executing it across channels, and seeing what happened.
Analytics had to live in that same system. It could not be another destination where marketers export their work just to measure it.
With Quotient Analytics, email, social, website, campaign, person, and company signals come together inside Quotient. The platform understands the campaign that produced the work because the campaign was built there. It understands the assets and channels because they were published there. And once the Quotient pixel is on your site, it can connect that activity to the visits and conversions that followed.
That changes the question from “Which dashboard should I open?” to “What happened with this campaign?”
Start with the part nobody wants to maintain
UTM tagging is important. It is also exactly the kind of small, repetitive task that gets skipped when a team is moving fast.
Every link published through Quotient is tagged automatically with consistent UTM and Quotient-specific parameters. You still get clean, readable attribution in GA4. Your team does not need to remember the convention, find the spreadsheet, or manually apply it to every email and social post.
This is a small detail with an outsized effect. Reliable attribution starts before a campaign launches, not when someone tries to explain results in the Monday meeting.
One view of the journey, not a pile of channel reports
Channel metrics still matter. You need to know whether an email was delivered, whether people clicked it, and how a post performed. Quotient Analytics brings those signals together with the activity that happens on your site.
Email performance, without the export
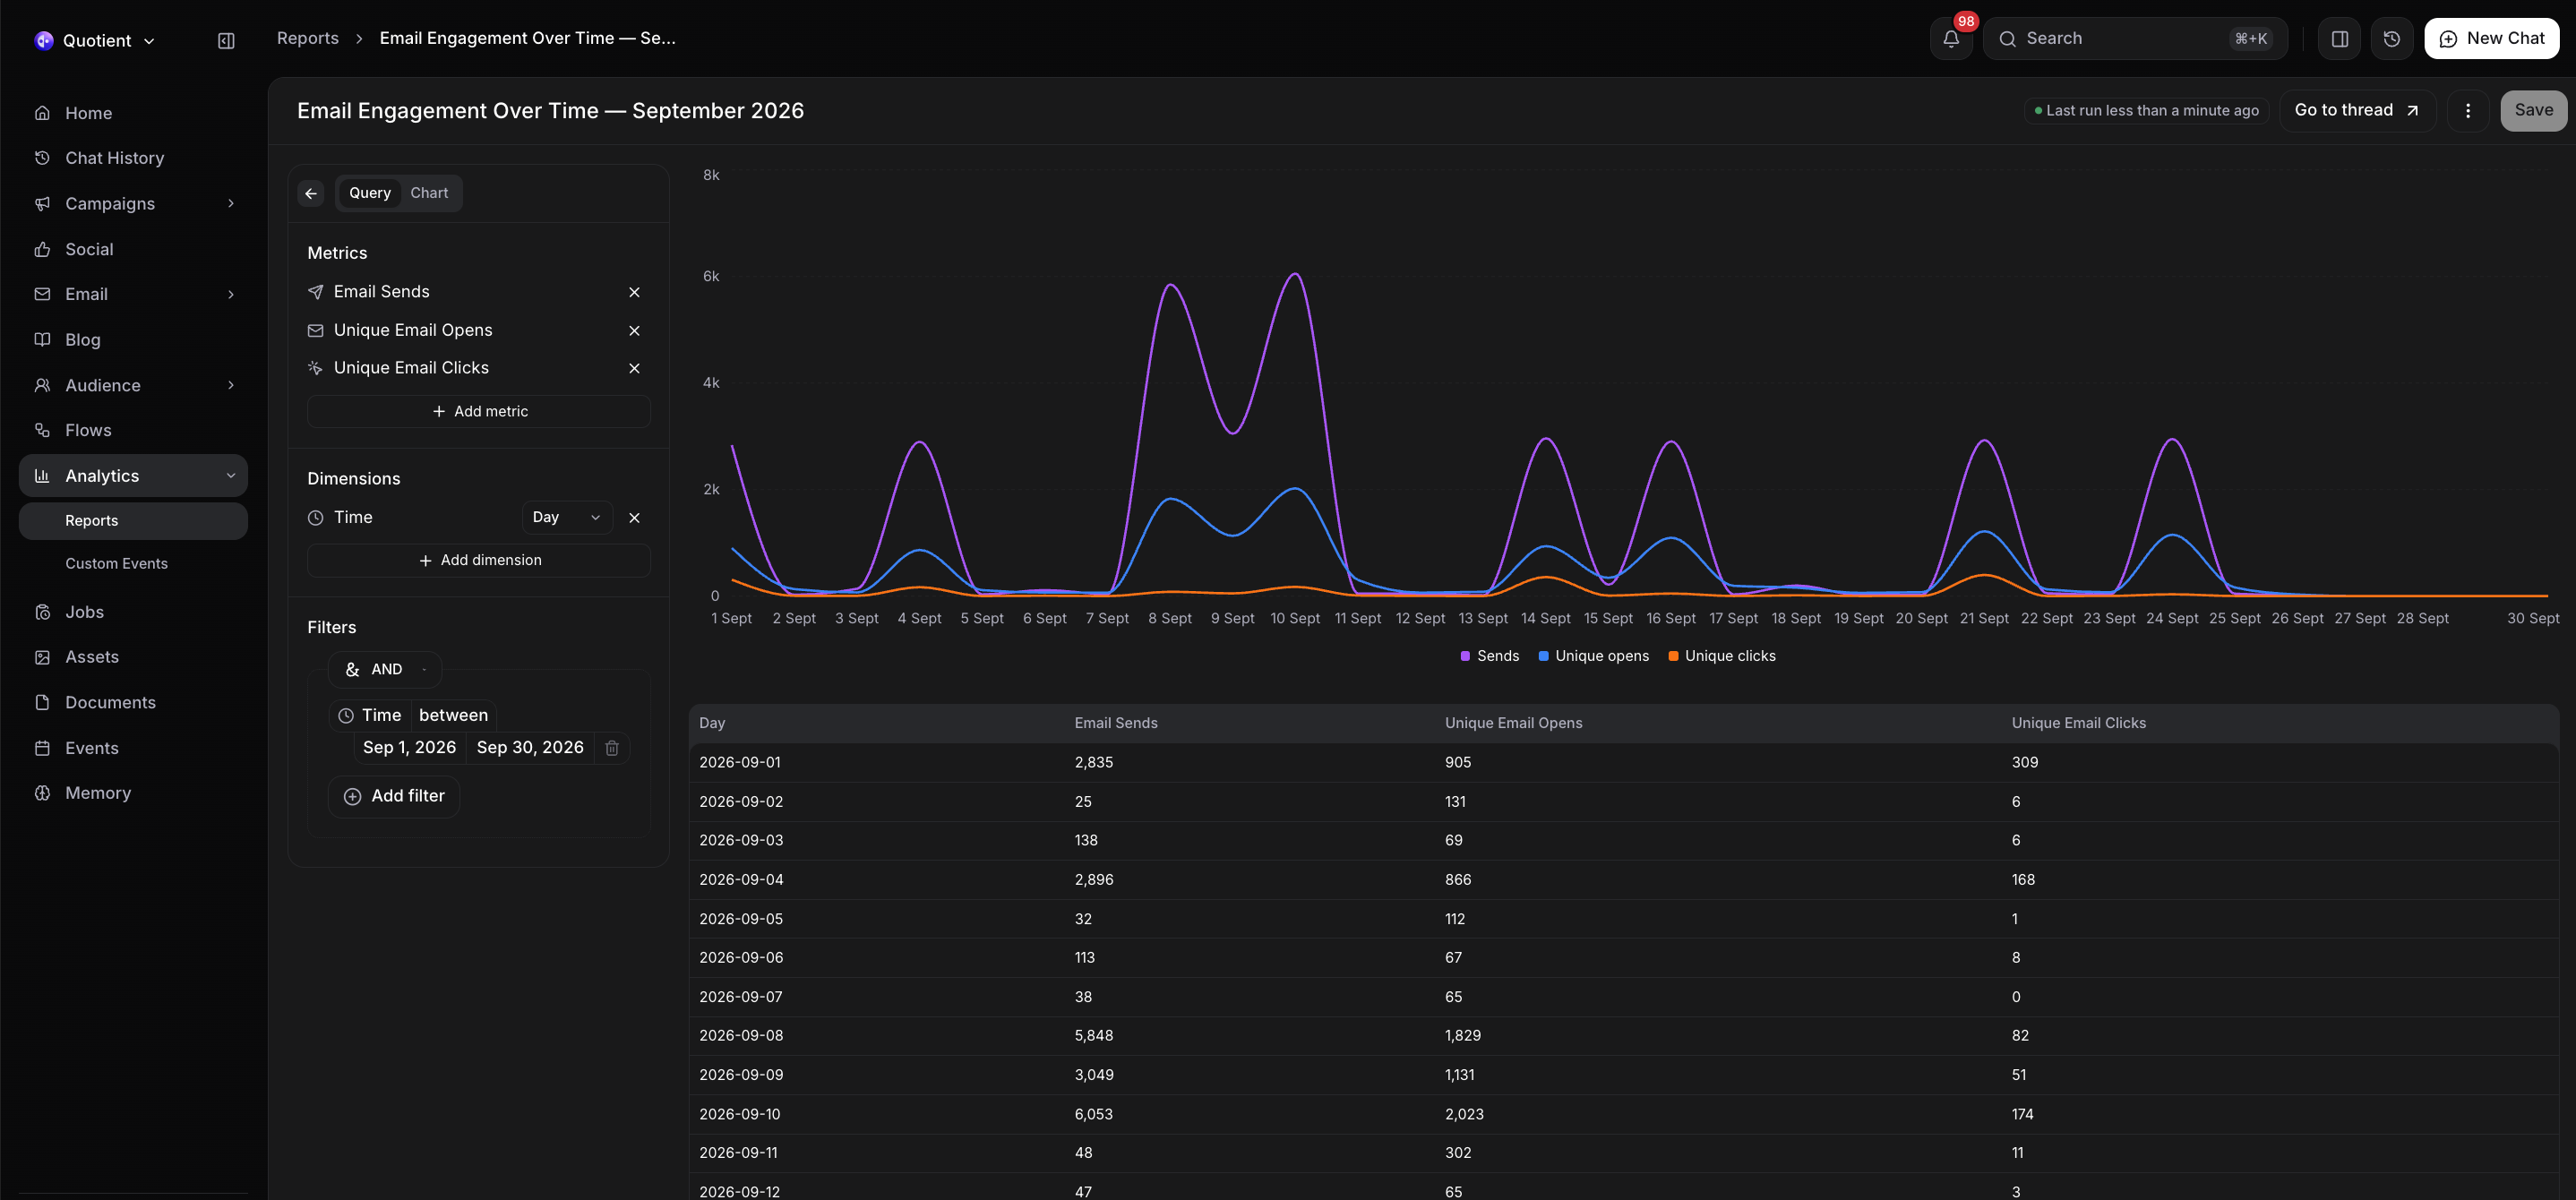
Track sends, unique opens, and unique clicks over time in the same reporting workspace. You can see the shape of engagement at a glance, then dig into the days that deserve an explanation.
Social performance in the same view
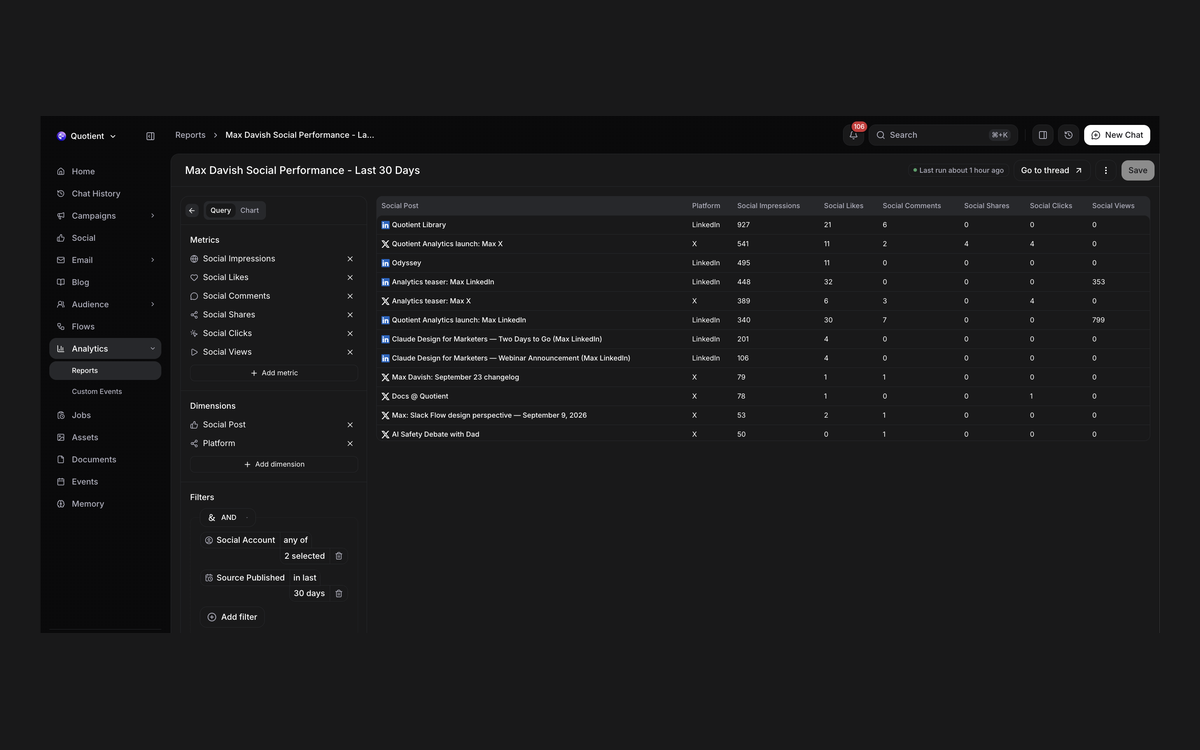
See the social performance the platforms make available, including impressions, likes, comments, shares, clicks, and views. Filter by account or platform to find the posts that earned attention instead of guessing from a stream of notifications.
Website activity that keeps the source attached
Add the Quotient pixel and you can connect source interactions with page views, sessions, visitors, navigation, and conversion activity on your website. The source does not disappear the moment someone leaves the channel where they found you.
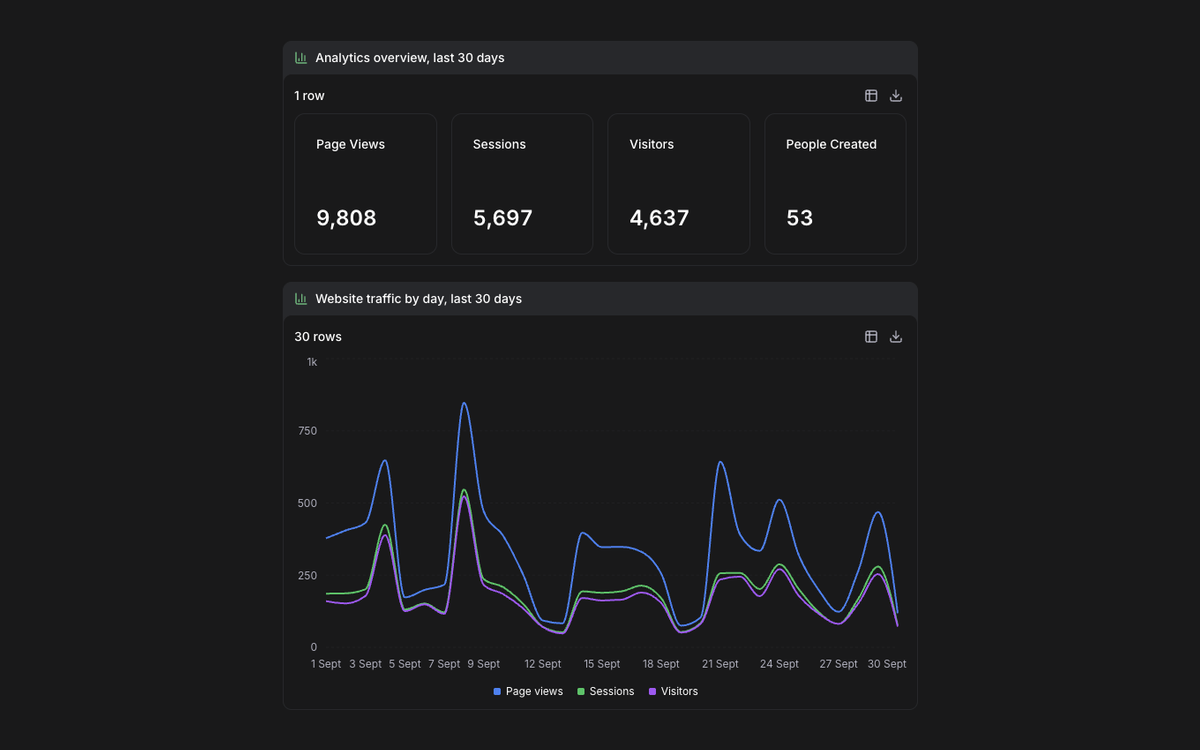
At the campaign level, this gives you a clearer picture of what your work produced. At the person and company level, it gives you the journey behind the aggregate number: the email opened, the social post clicked, the pages visited, and the meaningful actions that came next.
Ask a question instead of building a report
There is another problem with modern analytics: having the data does not mean you can get an answer quickly.
Most reporting tools assume somebody is willing to spend an afternoon building the right view. That works for a dedicated analyst. It is a poor fit for the marketer who wants to know which launch asset drove the most engaged visits this week.
Quotient’s analytics skill lets you ask questions in plain language. Ask what is performing, where engagement is coming from, which campaign produced the strongest result, or what changed over time. The agent can analyze the data, surface an answer, and help you save reports worth returning to.
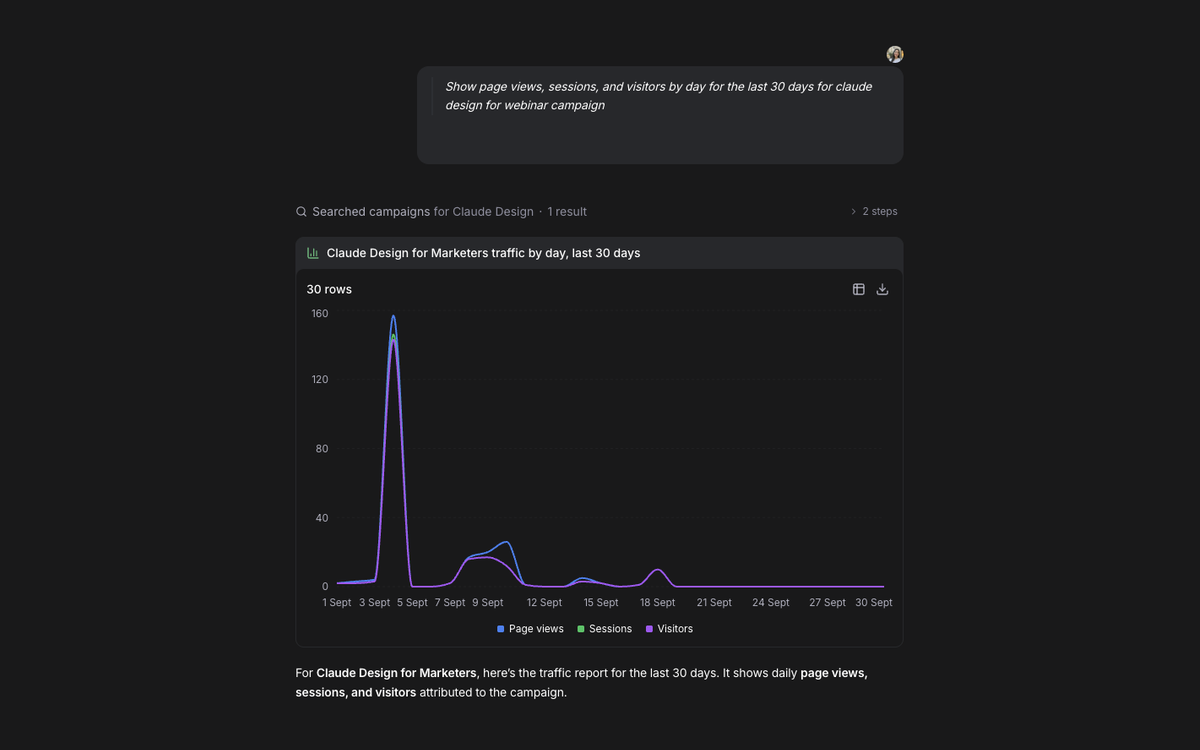
The point is not to make reporting feel more impressive. The point is to make learning part of the normal rhythm of running marketing.
Website analytics should not become a developer project
Getting started is straightforward. Create a public API key with Analytics write permission, add your domain as an allowed origin, and install a small Quotient pixel snippet.
The pixel tracks page views and navigation while retaining the marketing source behind each visit. We have installation guidance for Webflow, Framer, WordPress, and custom websites. For most teams, this should take minutes, not a sprint.
Once it is in place, the feedback loop starts working. Your campaign execution creates the data. The data explains the campaign. The next campaign starts with a little more context than the last one.
The feedback loop is the product
There are plenty of tools that can help produce more marketing. More drafts. More posts. More emails.
But marketing output without a feedback loop is just activity. Teams need to know what worked, understand why, and make the next decision with better evidence.
That is what makes Quotient an execution platform, not a content machine. The work lives here. The publishing happens here. Now, the learning happens here too.
Quotient Analytics is live today. If you are tired of stitching together your marketing story after the fact, explore Quotient Analytics.
Blog
Keep up with the latest
from Quotient
Similar Topics